Andrei GACEFF
![]()
BruteBenchmark
- simple, fast and relevant methods to check, save (and later
compare) the performance of a processor, video card and hard
disk.
The 4 categories of tests (CPU Integer, CPU Floating Point, 2D Graphics and Hard Disk performance) are presented in the first application tab, and can be started by pushing the coresponding big button image. After waiting for a certain amount of time ("benchmark duration", which the user can specify via the Change Settings option) and witnessing the benchmark progress bar filling up, the obtained scores will be cumulatively displayed in a list under the hardware's ID.
You will be able to stop the currently running benchmark if you will wish so, by re-pressing the same button that started the benchmark.
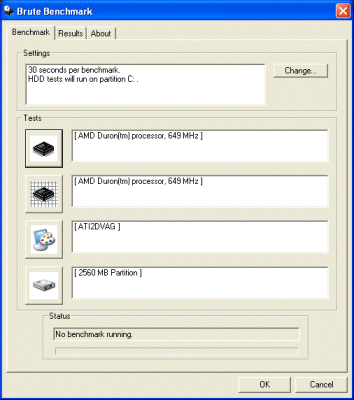
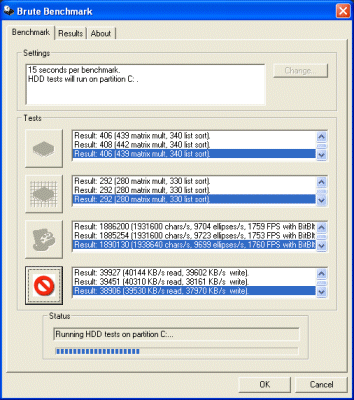
Note the the hardware's string ID will differ under different Operating Systems, containing more or less relevant information, which BruteBenchmark will use as the suggested hardware description field in the Save Results dialog.
The Settings that may be changed, at release 1.01, are:
- the benchmark duration (you can set it to be from 3 seconds to 1 hour interval). The default setting of 30 seconds should be used in most cases, and especially when saving and later comparing the results is intended. Lowering the duration under 30 seconds will make the benchmark extremely sensible the activity of any other concurent application and may yield lower results, while increasing the duration means not allowing you to use your computer during that long period. Input a high duration to test hardware heating and stability.
- the partition on which the read and write tests should be performed. The first, FAT formatted and unfragmented disk partition should be chosen to have the most accurate impression of the hard disk. Disk read and write performance drops towards the interior of the disk, and also with the increase of free space fragmentation. Moreover, NTFS I/O performance when accessing one huge file is inferior to that of FAT16/32.
The Results displayed are calculated based on the work completed by the tested hardware during some parallel or sequential tests:
- For CPU Integer performance 2 tests are performed by concurent threads; the matrix multiplication test weighs 66% and the linked-list bubble sort 33%. These tests are, both, "hard work" for the system processor, which has the chance here of showing its muscles (brute power) but also how well it handles concurrency and task switching, aided by its cache memory.
- Similar tests (2, on concurent threads) for CPU Floating Point (FPU) performance; the matrixes and the linked-list hold floating point values (of C++ type "double"); the matrix multiplication (which also involves applying a trigonometric function SINUS to the elements) weighs 75% and the list bubble sort 25% from the FPU result.
- For 2D Graphics performance 3 tests are run one after the other (coloured text drawing - 55%, coloured filled ellipses drawing - 18%, and horizontal scrolling a window using the BitBlockTransfer hardware accelerated function of the 2D graphics adapters - 27%).

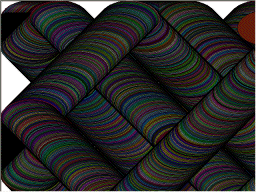

Today's most used type of applications are documment editing and Internet browsing, and, in this context, a lot of text and graphics drawing is involved, as well as lot of scrolling. BruteBenchmark tests these accordingly.
- For HDD performance a writing test (randomly generated data is put into a growing file on the disk) is performed first (for half the benchmark duration), followed by reading (unbuffered) the same file. The writing speed values 40% of the HDD result and the reading speed weighs 60%. The HDD test result is measured in Kbytes per second.
The results you obtained will automatically be entered a chart (in the Results Tab of BruteBenchmark), and the benchmark will place them between the closest values it finds in its result database.
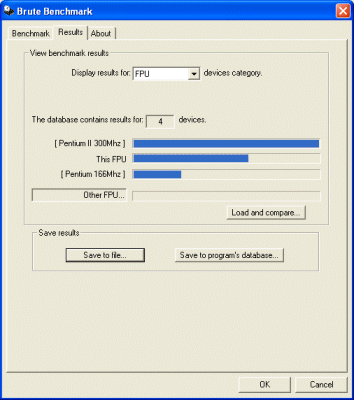
Benchmark results of other devices (or from same devices but in other conditions, overclocked, for example), previously obtained and saved (to a file with the .bbr extension) can be loaded for comparison. Not only can the user compare its, say, CPU with another CPU that he considers upgrading to, but he can also observe overclocking performance gain by saving benchmark results obtained at different CPU frequency.
You
are encouraged to test the impact of many bios settings on
hardware performance.
Notes:
- the results in the program's database were gathered by running the tests mainly under Windows 98;
- this program is a benchmark, and as such, its functionality is greatly influenced by concurrent running processes which share resources with it; close other applications (including taskbar-minimized applications) prior to starting a test;

- BruteBenchmark does not make use of microprocessor instructions extensions (like 3DNow!, SSE) directly. These special instructions can, indeed, when used, greatly improve data processing, but it is also true that most office applications do not make use of them. So, this benchmark program is still useful to capture and depict the raw performance that your PC makes available for everyday office and business suites applications.
- the operating system can spend a lot of time issuing GUI event messages and handling them; the user can start such an avalanche of GUI events just by hovering with the mouse cursor over applications windows, icons and other interface components, using a lot of processor time and graphics power. It is advisable not to move the mouse during the tests; the 2D graphics card test is especially sensible to mouse movement.
- do not close or cover the 2D test window (that BruteBenchmark creates) with over windows. This definitely voids the results, since the video card driver is surely optimized not to draw window regions that are not visible.
Download:
- version 1.12 (December 2003); the partition selection (in Change Settings dialog) is handled better by the program; several new device scores were added to the benchmark's results database.
- version 1.01 (November 2003); requires no installation, just unzip and run the executable.
Compatibility: This benchmark was designed so that it can be run on all Windows family operating systems (9x, Me, NT3.5, NT4, 2000, XP); there is no reason why it should not do so. What differs on these OSes is the component identification strings that BruteBenchmark displays (because the registry stores information differently). Also, the benchmark results can and probably will differ (on the same PC machine but when booting a different Operating System); this is not a bug, but instead can prove to be useful to determine which OS runs faster on a specific configuration.
Known problems: The third 2D test - window scrolling - can take more time than the user specified, and may provide variable scores under certain conditions, especially when benchmark duration was set for less than 30 seconds. This is due to the fact that video manufacturers optimize BitBlt loops in their drivers, causing applications' timer messages to be posted with delay; also, I could not determine exactly what can break these optimized loops, so that, the more of the loop is executed "optimized", uninterrupted, the bigger the benchmark score gets.
Contact me at andreigaceff@yahoo.com for anything related to BruteBenchmark.